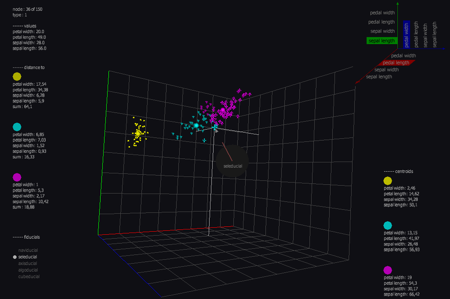
I am going to present a few projects on my blog in which I collaborated in one or the other way. This post introduces Fabio Campos‘s VotkA (Visualization of the k-means Algorithm) project of the course Visualization in the Master’s studies of Computer Sciences at the RheinMain University of Applied Sciences. Fabio’s project is a 3D visualization of the k-means algorithm applied to Fisher’s dataset. The user can interact with the visualization via reacTIVision/Fiducials or the OSCRemote application on the iPhone/iPod Touch.

Figure 1: 3D scatter plot of Fisher’s dataset assorted with the k-means algorithm
In VotkA users can interact with a three-dimensional cluster analysis visualization via a Tangible User Interface (TUI), the iPhone app OSCRemote or both in parallel. The TUI is provided by a small box that is technically based on Seth Sandler’s cheap multi-touch pad (you can see the box in the youtube video at the end of this article). On top of the box fiducials from reacTIVision are being tracked. Whenever a fiducial is being recognized a TUIO message with the fiducial’s id, position and rotation will be sent to VotkA.
Continue reading “VotkA: 3D Visualization of the k-means Algorithm using Fiducials, Processing, TUIO and OSCRemote”


