I am going to present a few projects on my blog in which I collaborated in one or the other way. This post introduces Fabio Campos‘s VotkA (Visualization of the k-means Algorithm) project of the course Visualization in the Master’s studies of Computer Sciences at the RheinMain University of Applied Sciences. Fabio’s project is a 3D visualization of the k-means algorithm applied to Fisher’s dataset. The user can interact with the visualization via reacTIVision/Fiducials or the OSCRemote application on the iPhone/iPod Touch.

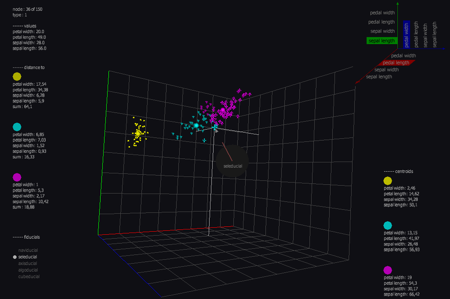
Figure 1: 3D scatter plot of Fisher’s dataset assorted with the k-means algorithm
In VotkA users can interact with a three-dimensional cluster analysis visualization via a Tangible User Interface (TUI), the iPhone app OSCRemote or both in parallel. The TUI is provided by a small box that is technically based on Seth Sandler’s cheap multi-touch pad (you can see the box in the youtube video at the end of this article). On top of the box fiducials from reacTIVision are being tracked. Whenever a fiducial is being recognized a TUIO message with the fiducial’s id, position and rotation will be sent to VotkA.
In terms of the cluster analysis the k-means algorithm has been implemented. The underlying multivariate data that is being visualized is Fisher’s iris dataset. In this dataset different aspects of iris blossoms are being stored (e.g. petal length/width, sepal length/width). Within the visualization this data is being dispersed in a cube according to different aspects (e.g. on the x-axis petal length, on the y axis sepal width and on the y-axis sepal height).

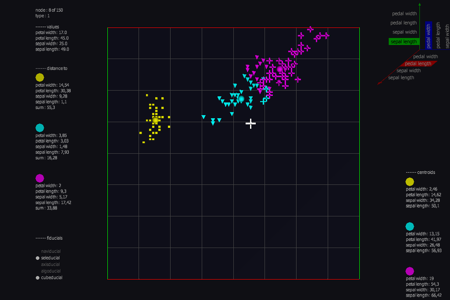
Figure 2: Scatter plot projected on the dimenions sepal length / petal length
The implemented visualization methods 3D scatter plot (see figure 1), scatter plot matrix / Grand Tour have been slightly adjusted to visualize Fisher’s dataset. The interaction with the Grand Tour visualization method is being carried out in the TUI with a real cube, which incorporates the projection of the three-dimensional data on the dimensional layers in the graph. By tilting the cube in the application the appropriate projection side will be displayed on the screen (see figure 2 and video).
When interacting via fiducials an additional sound feedback mechanism has been provided by converting TUIO messages in VotkA to midi signals that are being sent to a software sequencer. Midi channels are mapped to fiducial ids and midi signals are produced according to position and rotation of the fiducials. Actually it should not have been necessary to convert TUIO messages in VotkA to midi because reacTIVision supports both outputs, midi and TUIO. However, only one output channel at a time can be handled by reacTIVision.
Video of interaction with VotkA. Please note that colors are being poorly displayed and that midi sound output has been disabled in this video:
Employed technologies:
- Java
- Processing for VotkA’s visualization part and for TUIO message processing
- reacTIVision for fiducial tracking
- mmj-Library for midi production in VotkA
- k-Means for cluster analysis
- Fisher’s Iris Dataset
- OSCRemote App as iPhone TUIO Client (for the production of the OSC messages)
